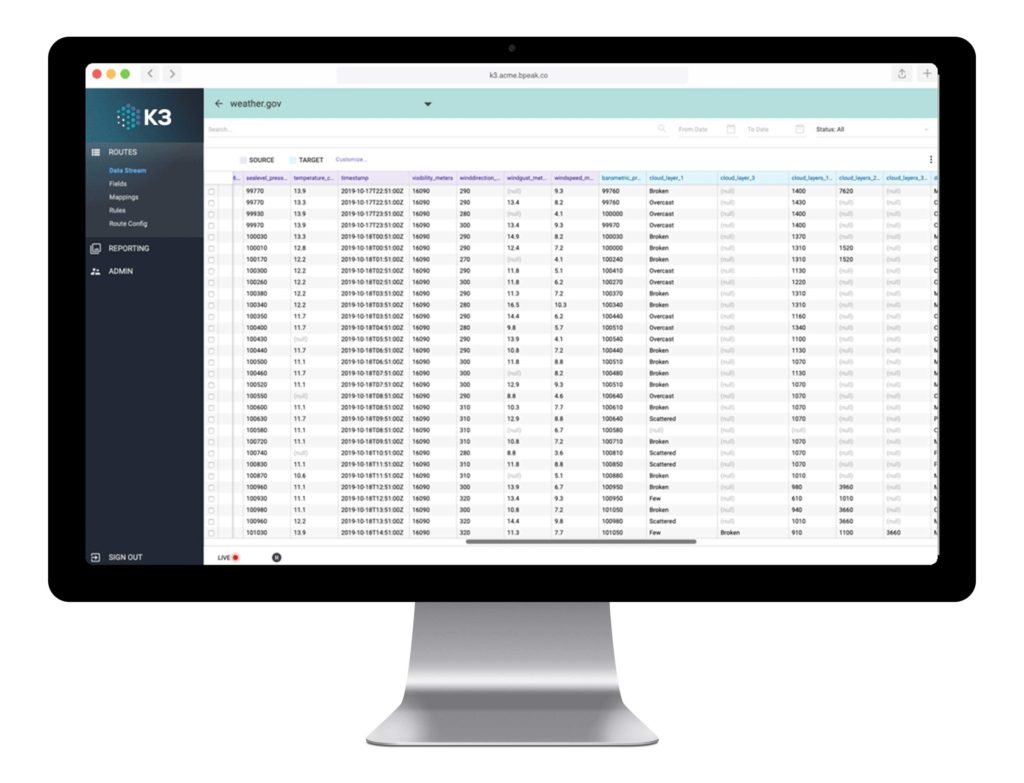
Big data analytics are increasingly defined by data visualization tools. The ability to gain insight from KPI dashboards and visualize data beyond pie charts and bar graphs is one of the benefits of business intelligence—and, increasingly, a key competitive advantage for businesses.
Broadpeak Partners data integration tools can bring your data visualization dreams into reality, even when you’re taking data from legacy mainframe systems. K3 is battle tested in large organizations and has a wide variety of connectors that enable it to easily digest mainframe data. Once it has been extracted, cleaned and organized by K3 the rest is data analysis history. Whether you’re using a Tableau desktop, Salesforce connections, or any tool built around trusted data design principles, your data visualization can be as strong as the data you utilize. That’s where k3 data integration comes in.
Gartner predicts that augmented analytics technology—such as data visualization tools— will be ubiquitous by 2022, but only 10% of analysts will use its full potential. Here’s how to make your data more accessible to visualization tools using k3 data integration.
Gartner predicts that augmented analytics technology—such as data visualization tools— will be ubiquitous by 2022, but only 10% of analysts will use its full potential.
Redshift AWS & Snowflake Data: A Primer
The data used in visualization tools have to come from somewhere, and few sources are more popular than Amazon Web Service (AWS) data warehouses. Known as Amazon Redshift, AWS’ data warehouse also has the ability to directly query Amazon’s S3 data lake, allowing for faster access to a wider array of data.
Many data visualization examples rely on Redshift. Getting your data into Redshift, however, is best done through low-code k3 ETL tools that make the process more efficient than ever.
Redshift isn’t the only option when it comes to the data visualization executive dashboard. Examples of similar data clouds include Snowflake, whose multi-purpose data access tools make it a popular choice for business intelligence.
Data Visualization Tools Vendors
PRO TIP:
Focus on the features you know you’ll use when choosing a data visualization vendor.
Whether you’re using an AWS data warehouse or Snowflake data, there are a variety of tools available to help visualize your business intelligence. Some of the top vendors mentioned by Gartner include:
There are even more data visualization tools than the ones listed above, and industry competitiveness ensures constant deployment of new features and techniques. Regardless, having the right data available no matter the visualization tools is what’s most important. K3 data integration adaptors ensure your most valuable business resource remains accessible via Redshift or Snowflake, no matter the visualization tools you use, now and in the future.
K3 data integration adaptors ensure your most valuable business resource remains accessible via Redshift or Snowflake, no matter the visualization tools you use, now and in the future.
Getting Started With Data Visualization
Better business intelligence through data visualization starts with k3 data prep. Broadpeak Partners ETL tools make it easy to create a powerful data integration pipeline for your business, streaming data in minutes to Redshift or Snowflake.
No matter the database or legacy mainframe, It’s easier than ever to go from “What is Tableau?” to mastering embedded analytics with data visualization. Getting started is as simple as scheduling a demo to see how your data visualization needs can be met and exceeded, starting with K3 ETL:


